
Renowned crypto analyst Ali Martinez has predicted a potential breakout for Celestia (TIA), with the token possibly surging to $4.40 if it successfully surpasses the $3.50 resistance level.
Martinez based his forecast on the TD Sequential indicator, which recently flashed a buy signal on Celestia’s daily chart.
The signal, often used to identify trend reversals and buying opportunities, suggests a growing bullish momentum.
If the resistance level is breached, traders could see a significant upward move, fueling optimism among investors.
Strong Price Growth and Market Participation Boosts Celestia’s Momentum
Celestia (TIA) has shown notable price appreciation in recent trading sessions, currently standing at $3.63 after a 12.85% increase in the past 24 hours.
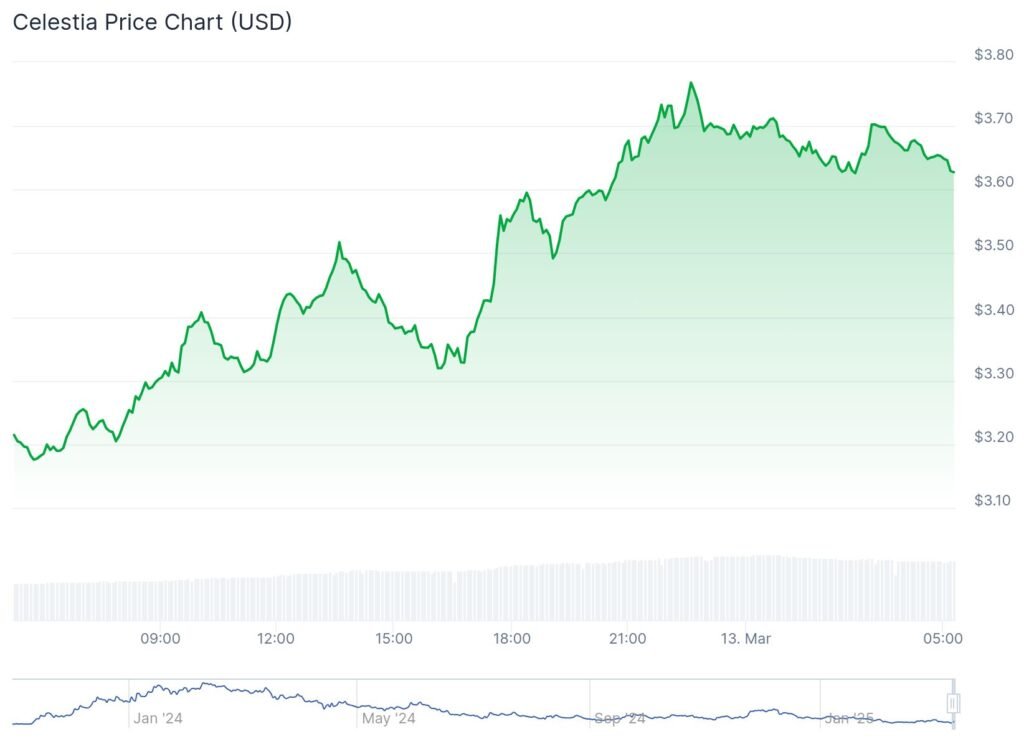
Over the past week, the token has gained 5.50%, reflecting positive sentiment in the market. Additionally, Celestia’s daily trading volume has exceeded $211 million, demonstrating heightened investor participation.
With a circulating supply of 540 million TIA, the token’s market capitalization has climbed to an impressive $1.95 billion, further cementing its position as a key player in the crypto space.
Also Read: Crypto Analyst Ali Sees $0.30 Target For $OP As Optimism Breaks Out Of Pattern
Technical Indicators and Market Sentiment Suggest Continued Growth
The TD Sequential buy signal indicates that Celestia might be gearing up for an extended rally, provided it can maintain its current momentum.
If the price successfully breaks above the $3.50 resistance, Martinez believes the next target will be $4.40.
The growing buying pressure, strong market fundamentals, and increasing investor interest all support the possibility of further gains.
However, analysts caution that traders should monitor resistance levels and potential pullbacks before making investment decisions, as market volatility remains a key factor.
TIA’s Historical Performance and Recent Market Trends
Despite the recent bullish sentiment, Celestia has been under bearish control for much of the past year. In early December 2024, the token reached a high of $9.25, briefly breaking above key Exponential Moving Averages (EMAs).

However, buyers struggled to sustain momentum, and the price fell below the 50 and 200-day EMAs. TradingView data shows that TIA has been in a prolonged bearish phase, with a 79.44% decline over the past year.
Nonetheless, in the last three months, the token has rebounded by 52.89%, with an 8.94% increase last month.
While it dipped by 1% last week, the overall outlook suggests that a breakout could still be on the horizon if bullish momentum continues.
Also Read: Crypto Analyst Predicts $THETA Bearish Breakout from Parallel Channel Toward $0.30 Price Level


 could rally to $4.40 if it breaks past $3.50 resistance, citing bullish signals from the TD Sequential indicator.)