


The price trajectory of Virtual has been a little disappointing for many traders, given the current slump that the token is witnessing.
However, Ali Martinez via a X post mentions “Keep an eye on VIRTUAL! A breakout from this descending triangle could set the stage for a move toward $0.50.”
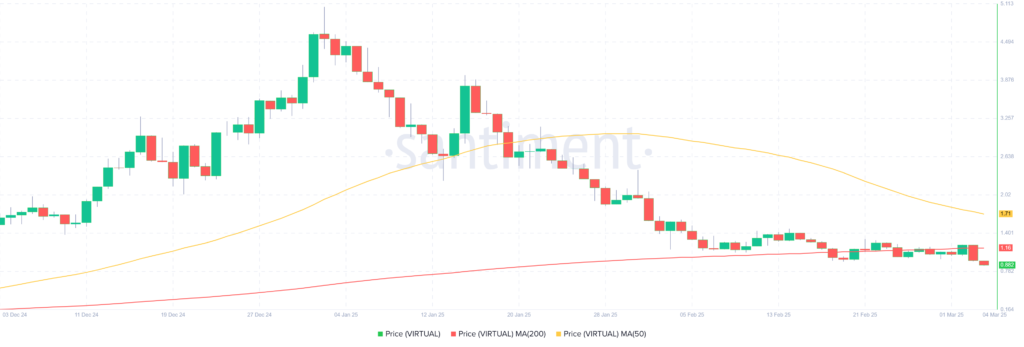
The prediction comes at a time when $VIRTUAL is trading at $0.8795, down 21.14% as compared to the same time last day. The market cap of the token currently stands at $571.16 million, after taking a dip of nearly 21.12%.
Virtual’s Descending Triangle Breakout Keeps Traders on Edge
Since $VIRTUAL is exhibiting indications of a possible breakout from a descending triangle pattern, traders and analysts are keeping a careful eye on its price action.
With analysts projecting a potential increase towards $0.50, a breakout from this pattern might mark the beginning of a positive surge. This could be a positive sign for traders who have seen a huge plunge in the vale of the token.
Although descending triangles are usually seen as bearish patterns, they frequently result in a significant increase in price when the price breaks over the resistance line.
Also Read: Virtuals Protocol Revenue Plummets 96% as AI Agent Hype Fades, Will $VIRTUALS Price Follow?
$VIRTUAL Price Prediction: What Is The Token Set For?
With technical indicators pointing to a potential breakout, $VIRTUAL has been displaying encouraging signs of a likely price increase.
A breakout over the upper trendline that the coin is currently trading in, however, would indicate a change in momentum and push the price upwards.
Short-term buying activity in $VIRTUAL could lead to a price increase if it breaks the triangle’s resistance and maintains momentum. Conversely, the price may undergo a downward correction if it is unable to overcome the barrier or drops below important support levels.
Virtual Technical Indicators Show Cautious but Positive Future
The technical indicators for $VIRTUAL presently show a cautious but perhaps optimistic outlook. A descending triangle, which is sometimes seen as a consolidation pattern preceding a breakthrough, is being formed by the price.
The Relative Strength Index (RSI) for $VIRTUAL is in the neutral zone, indicating that there isn’t a lot of buying or selling pressure. The market’s indecision is shown by the narrow movement of moving averages.
However, a significant upward move that would target $0.50 could result from a break over the resistance line of the descending triangle. In contrast, a downward trend can ensue if support levels are broken. For additional price action confirmation, traders should keep a careful eye on these crucial levels.
Also Read: Virtuals Protocol Expands To Solana For More Performance And Reach