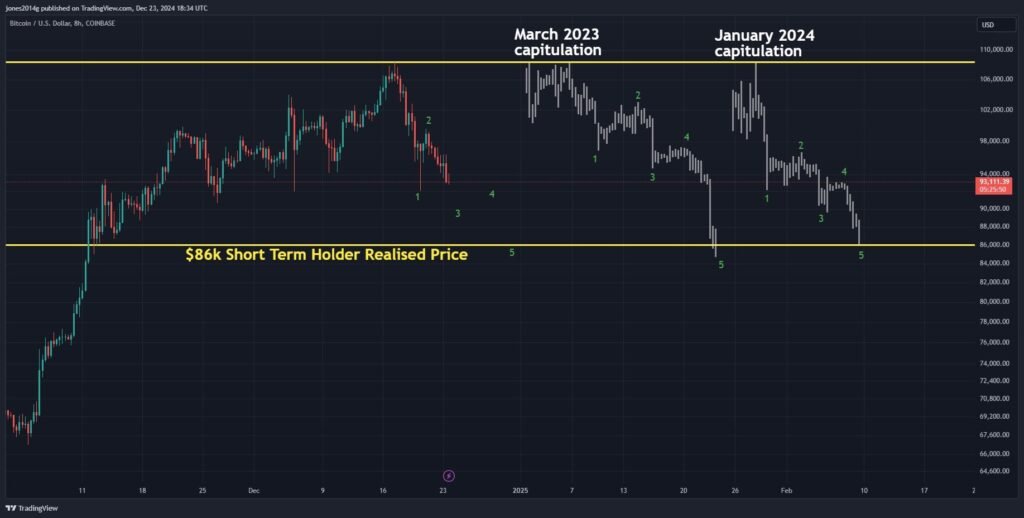
Bitcoin price has outperformed expectations in the market, showing that the coming year might likely witness a further surge in prices. The price for the OG-crypto currency has only been down 2% so far in December. This level comes as a surprise to many since the market had expected a crash to the mid-$80K level for Bitcoin.

At the press time, Bitcoin is trading at $94,677.69, down nearly 1% as compared to the same time last day.
Bitcoin Falls For Fourth Straight Session
Bitcoin saw a price drop for the fourth straight day on Tuesday, December 24th. The main reason behind Bitcoin’s decline after a surge triggered by Donald Trump’s victory in the presidential election lies in the lost momentum following the Federal Reserve’s hawkish stance last week.
Last week, Bitcoin saw its first weekly decline since Trump’s presidential victory in early November. A hawkish Fed’s stance on further rate cuts and economy partially hurt the risk appetite of investors making volatile assets like Bitcoin take a beating.
Despite this, Bitcoin has only been down 2% in December so far, indicating that an optimistic and core investors are still keeping high hopes for the future trajectory of the biggest cryptocurrency.
Also Read: Bank of Italy Labels Bitcoin P2P Services as “Crime-As-A-Service” Amid Money Laundering Issues
Fed’s Hawkish Stance Hurts Bitcoin’s Momentum
Despite lowering rates by 25 basis points, the US central bank only announced two rate cuts for the following year, as opposed to the four cuts that were previously anticipated.
Bitcoin’s price dropped as a result of investors reevaluating their holdings in speculative assets. The token had slipped below the critical $100,000 barrier last week as the Fed policymakers projected a slower pace for future cuts.
Bitcoin Technical Indicators: Are There Price Surge Indications?
Bitcoin technical indicators at present show a rather neutral state, making many in the market confused about what could happen next. The technical indicators reveal that the Fear & Greed Index for BTC is currently at 73 (Greed), while the attitude is neutral.
Over the previous 30 days, Bitcoin saw 3.25% price volatility and 14/30 (47%) green days. Of all the technical analysis indicators, 16 indicate optimistic signs, while 15 indicate bearish signals, giving a confused indication around what the future might look for Bitcoin.
In the same tone, one well-liked indicator for determining if a cryptocurrency is overbought (above 70) or oversold (below 30) is the Relative Strength Index (RSI) momentum wave. With the RSI rating at 44.69 right now, the Bitcoin market is in a neutral state.


