


 breaks out to a record $801, driven by strong technical momentum and investor optimism.)
Binance Coin (BNB) has now broken out of the range after ranging for nearly a year, registering a new all-time high of $801.8.
The rally picked momentum after a strong bounce back from June 2025 lows owing to entrenched technical robustness and growing investor optimism.
BNB has respected a sharply increasing trend line from August 2024, and while the spike initially began with cautious strength.
The recent month saw rising buying pressure pushing it to the new all-time high.
Technical Indicators Confirm the Legitimacy of BNB’s Breakout
Among the key technical feats of BNB was its close above the important level of resistance at $650, which had been preventing the token from being a strong ceiling in the past.
The breakout was signaled by two major technical indicators: the Relative Strength Index (RSI) and the Moving Average Convergence Divergence (MACD), both of which crossed over long-term resistance trend lines.
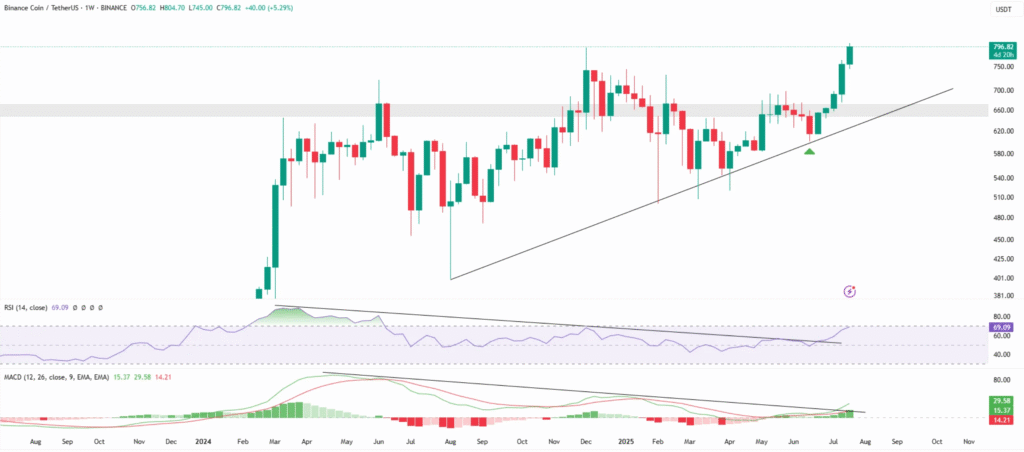
The given kind of action confirms that the current momentum is supported by internal strength and not just speculative peaks.
Now that the price has entered the “price discovery” phase, a period when there are no defined resistance levels, analysts are turning to predictive tools like Elliott Wave Theory to forecast BNB’s future trajectory.
Elliott Wave Analysis Suggests BNB is on Its Final Bullish Leg
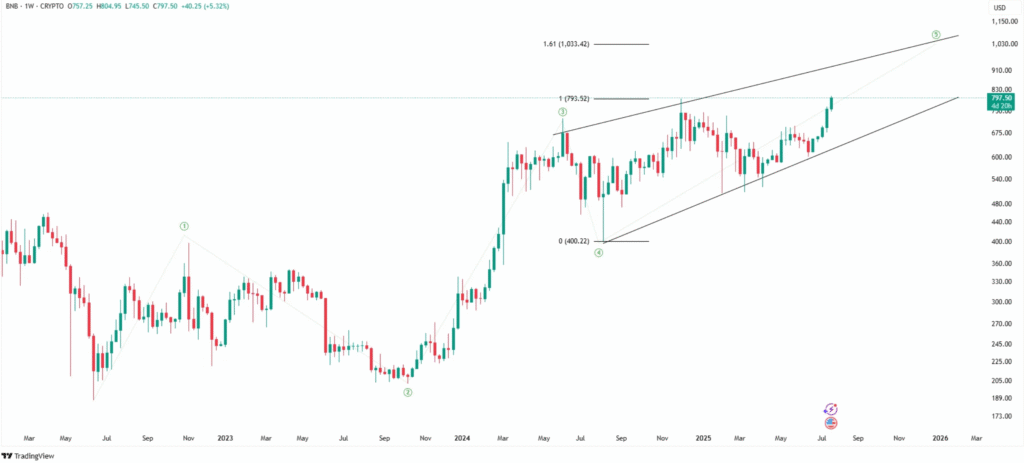
Elliott Wave (EW) analysis indicates that BNB is now within the fifth and terminal wave of an extended bulls run cycle initiated in June 2022.
The pattern of the waves also suggests wave five would predominantly be in the form of an “ending diagonal,” typically represented by a contracting wedge shape.
The recent pattern is supported by the fact that wave two happened to be deep and corrective while wave four was shallow and fast, which is according to EW’s alternation principle.
The wedge is expected to continue building up to December 2025, when its projected resistance line is expected to meet Fibonacci extension levels, specifically the 1.61 external retracement and the cycle top at approximately $1,033.
Market Sentiment and Momentum Support BNB’s Bull Run
At the time of writing, BNB is trading at $792.62 with a jaw-dropping 24-hour trade volume of over $3.1 billion, which suggests strong demand and high market activity.
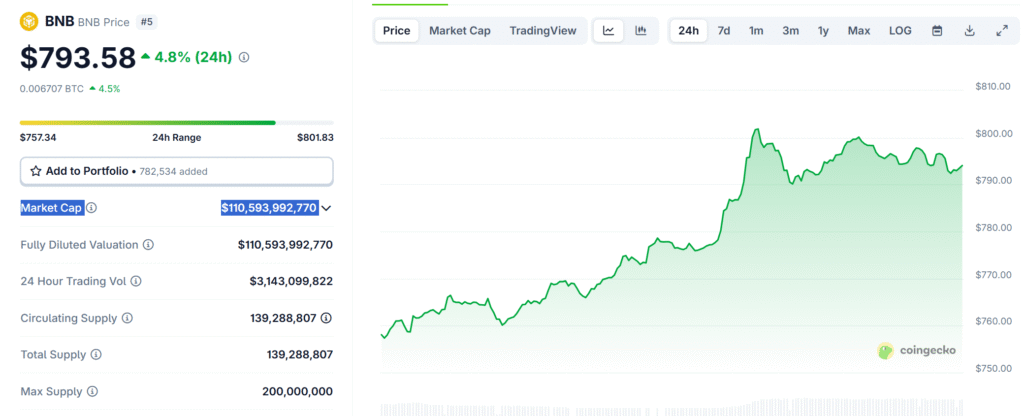
Over the past 7 days, BNB has increased by over 14%, showing stability across horizons.
With a total supply of 140 million tokens, BNB market capitalization is well above $110.5 billion, making it one of the top digital assets in terms of market capitalization.
The technical strength, confirmation of the longer-term bull trend, and increased attention from retail and institutional investors all support the forecast increase through to the later parts of 2025.
Also Read: Dogecoin Addresses Hit 83.48 Million, A New All-Time High, Will Price Follow Suit?
What’s Next: Possible Scenarios and Investor Expectations
Short-term, the key forecast is that BNB is to complete the follow-through diagonal pattern, incrementally advancing in an ascending wedge to and through $1,033 by December.
However, if the BNB escapes from this wedge early, it would be a sign that wave five is unfolding in more impulsive action, pushing prices yet higher at an even greater rate than expected.
While the base case is being contained, the current direction is open-minded according to market action.
Either way, the breakout of BNB put it back in the limelight, and traders will be looking to see future weekly candles and key trendline reactions probe the direction of the token.