
Ethereum’s current price is showing signs of a head and shoulder pattern and according to analyst, the token might have to find support soon.
Ali Martinez in a X post explained that in order to maintain the bullish structure and have a chance of reaching $7,000, Ethereum must remain above $2,700 incase it’s head-and-shoulders pattern continues.
An indication of a possible trend reversal in the financial market is a head and shoulders pattern on a chart. This technical analysis tool aids investors in anticipating when a bullish trend may come to an end and when a bearish trend may start and vice-versa.
New Prediction Comes as Ethereum Sees a Blood Bath
Ethereum prices are currently falling at a rapid pace, following a trend in the broader market. Earlier in the trading day, Ethereum’s value plummeted, falling 10.07% to close at $2,933.47.
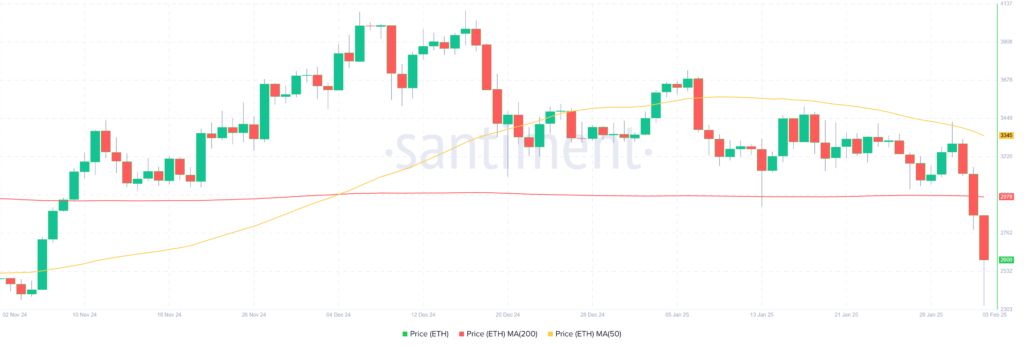
This was Ethereum’s biggest one-day drop since August 5, 2024. As a result of the steep decline, Ethereum’s market value dropped to $354.13 billion, or 18.59% of the overall market capitalization of cryptocurrencies.
Additionally investor concerns regarding the growth of the Ethereum ecosystem have also largely contributed to the muted trading of the token.
Can Ethereum Prices Rebound in Future?
The current blood bath in the crypto market, caused by Donald Trump’s tariff rules, can likely change in the future as and when optimistic signals show up.
In this tone, Ethereum’s price increase could be caused by a number of things. First, demand for ETH is increased by the broad use of Ethereum’s blockchain for non-fungible tokens (NFTs) and decentralized financing (DeFi).
More investors may be drawn to Ethereum 2.0, which upgrades the network to a proof-of-stake (PoS) mechanism that is more scalable and energy-efficient.
Ethereum’s reputation as a safe, long-term asset may be strengthened by institutional interest and regulatory certainty. Furthermore, the increasing demand for Ethereum due to its rising use in smart contracts, decentralized apps (dApps), and enterprise solutions may raise the price of the cryptocurrency as its uptake grows.
Also Read: Swiss Bank UBS Tests Key4 Gold on Ethereum’s ZKSync L2, Allows Swiss Customers to Buy Physical Gold
ETH Market Parameters: What Do They Say?
The present sentiment for Ethereum is bearish, according to market indicators, and the Fear & Greed Index is at 44 (Fear).
Ethereum’s price volatility over the past 30 days was 4.39%, with 14/30 (47%) green days. With four technical analysis indicators indicating optimistic signals and twenty-four indicating bearish indications, the overall sentiment for the price prognosis of Ethereum is pessimistic.
An indicator that is widely used to determine if a cryptocurrency is overbought (above 70) or oversold (below 30) is the Relative Strength Index (RSI) momentum oscillator. The ETH market is now in a neutral position, as shown by the RSI reading of 34.67.
Also Read: Massive Short Position on Hyperliquid Yields $44M in Unrealized Profits as Ethereum Price Plummets

